Assignment 2: Fabrication - Multi-color 3D Printing
Completed by: Fatima Mamu & Joachim Asare
Aim: Fabricating a multi-color 3D printing of air pollution visualization of African countries by geospatial arrangement.
Dataset
The dataset was curated from the World Health Organization (WHO) dataset of air quality for all countries.
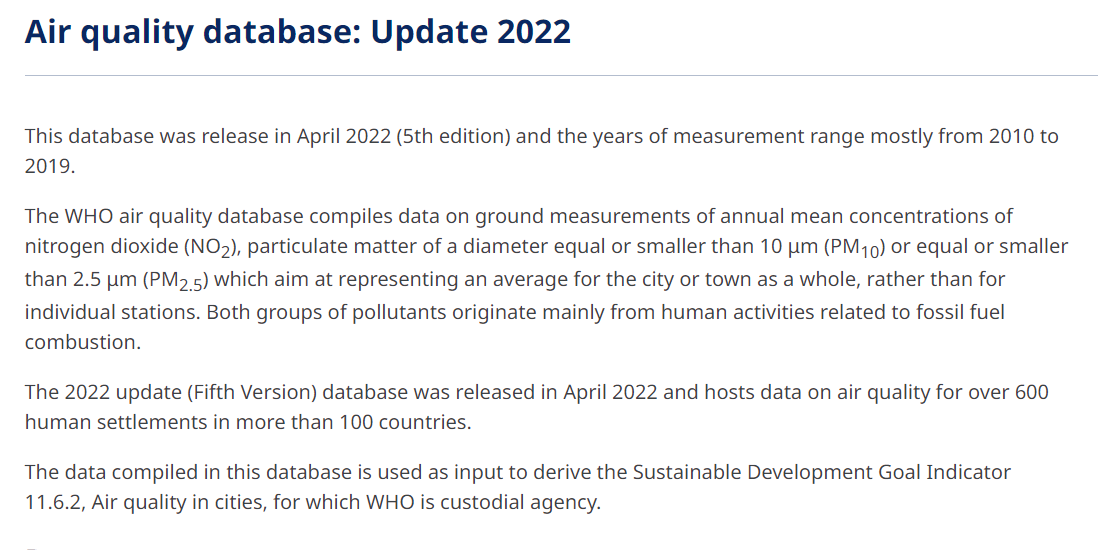 Visual representation of the dataset
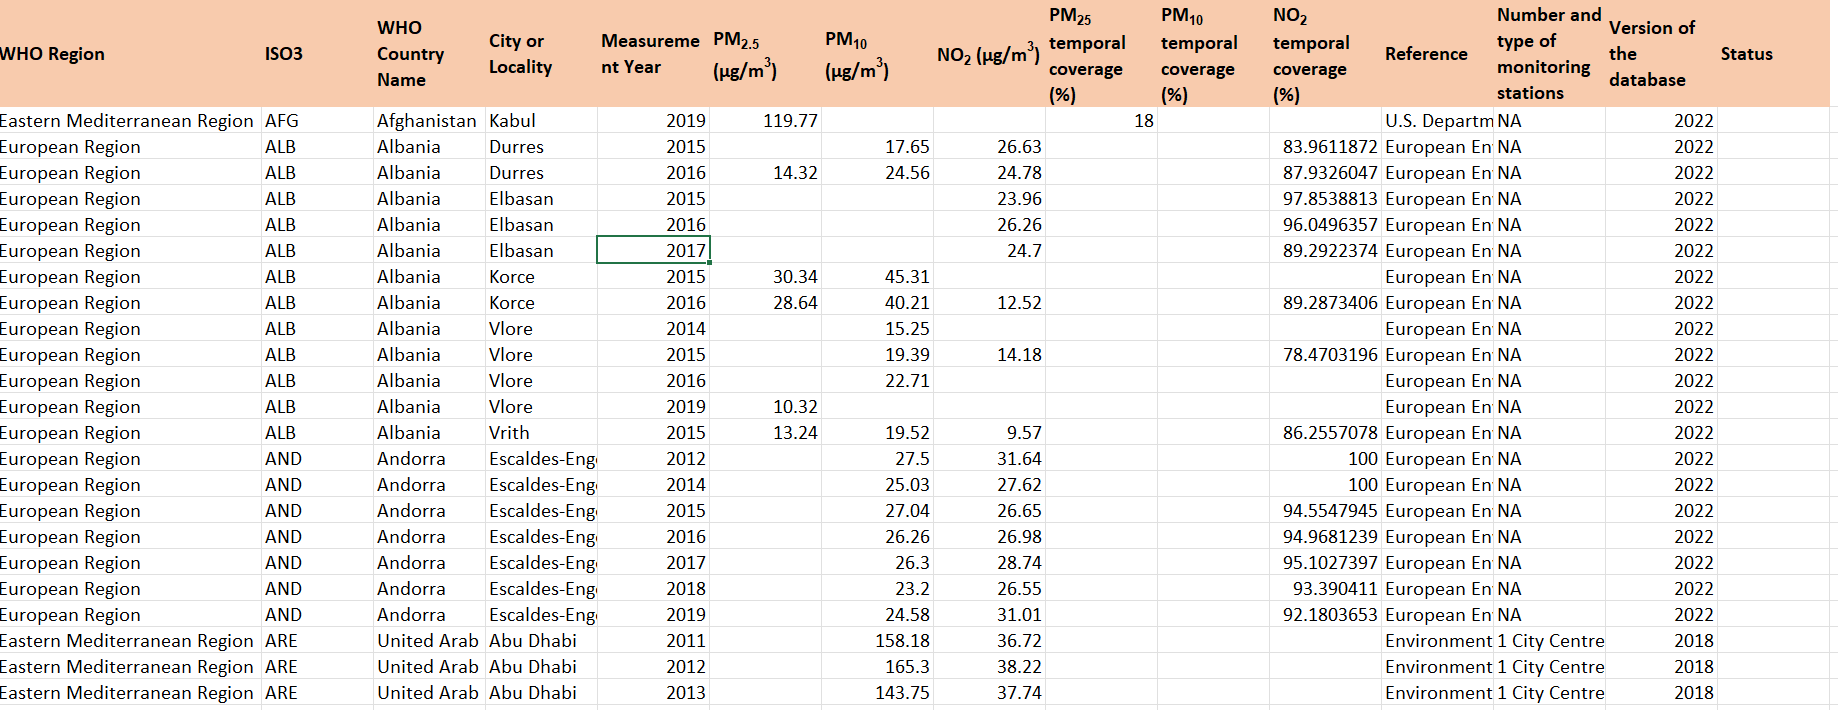 Chart illustrating the dataset metrics
Cleaning and Curation of the Dataset
Using Python to filter African countries only from the dataset, calculate average AQI values for each country based on values from cities within the country, and then added latitude and longitude data for each country.
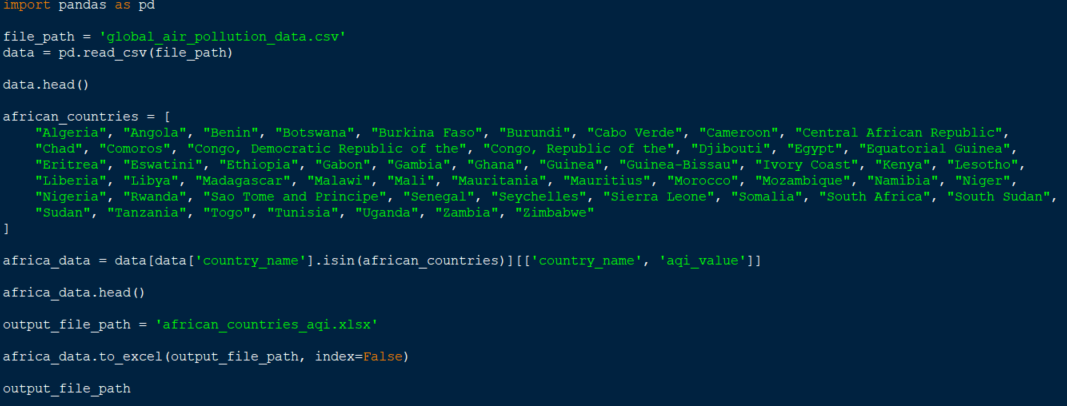
African countries filter
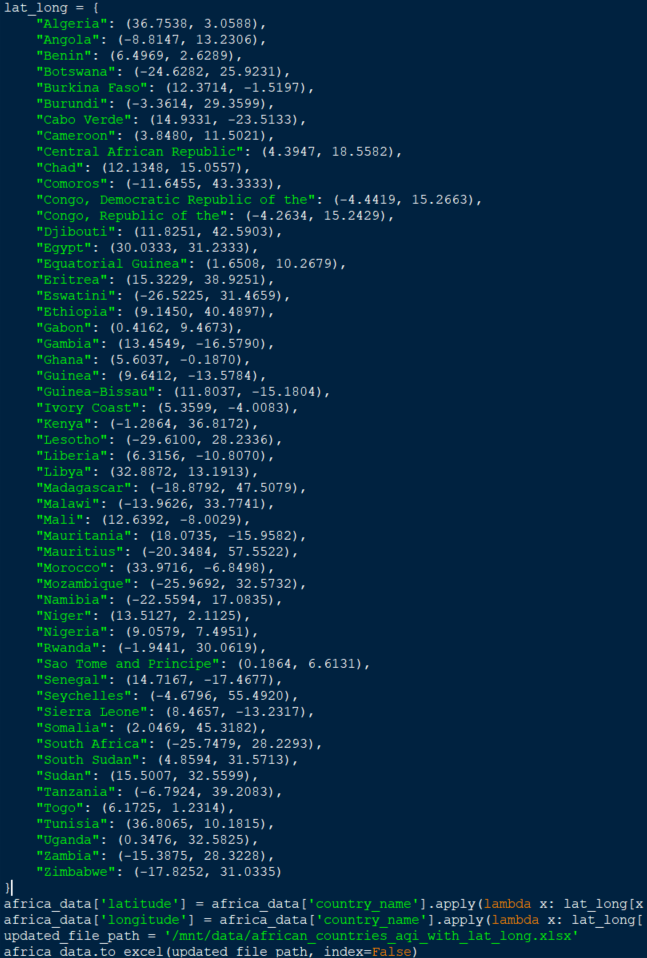
Average AQI for African countries
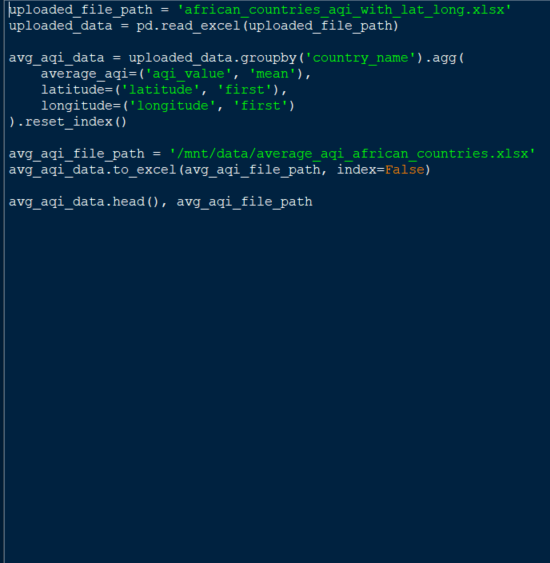
Addition of Latitude and Longitude
Design Rules from the Dataset
- A 3D base of the African map.
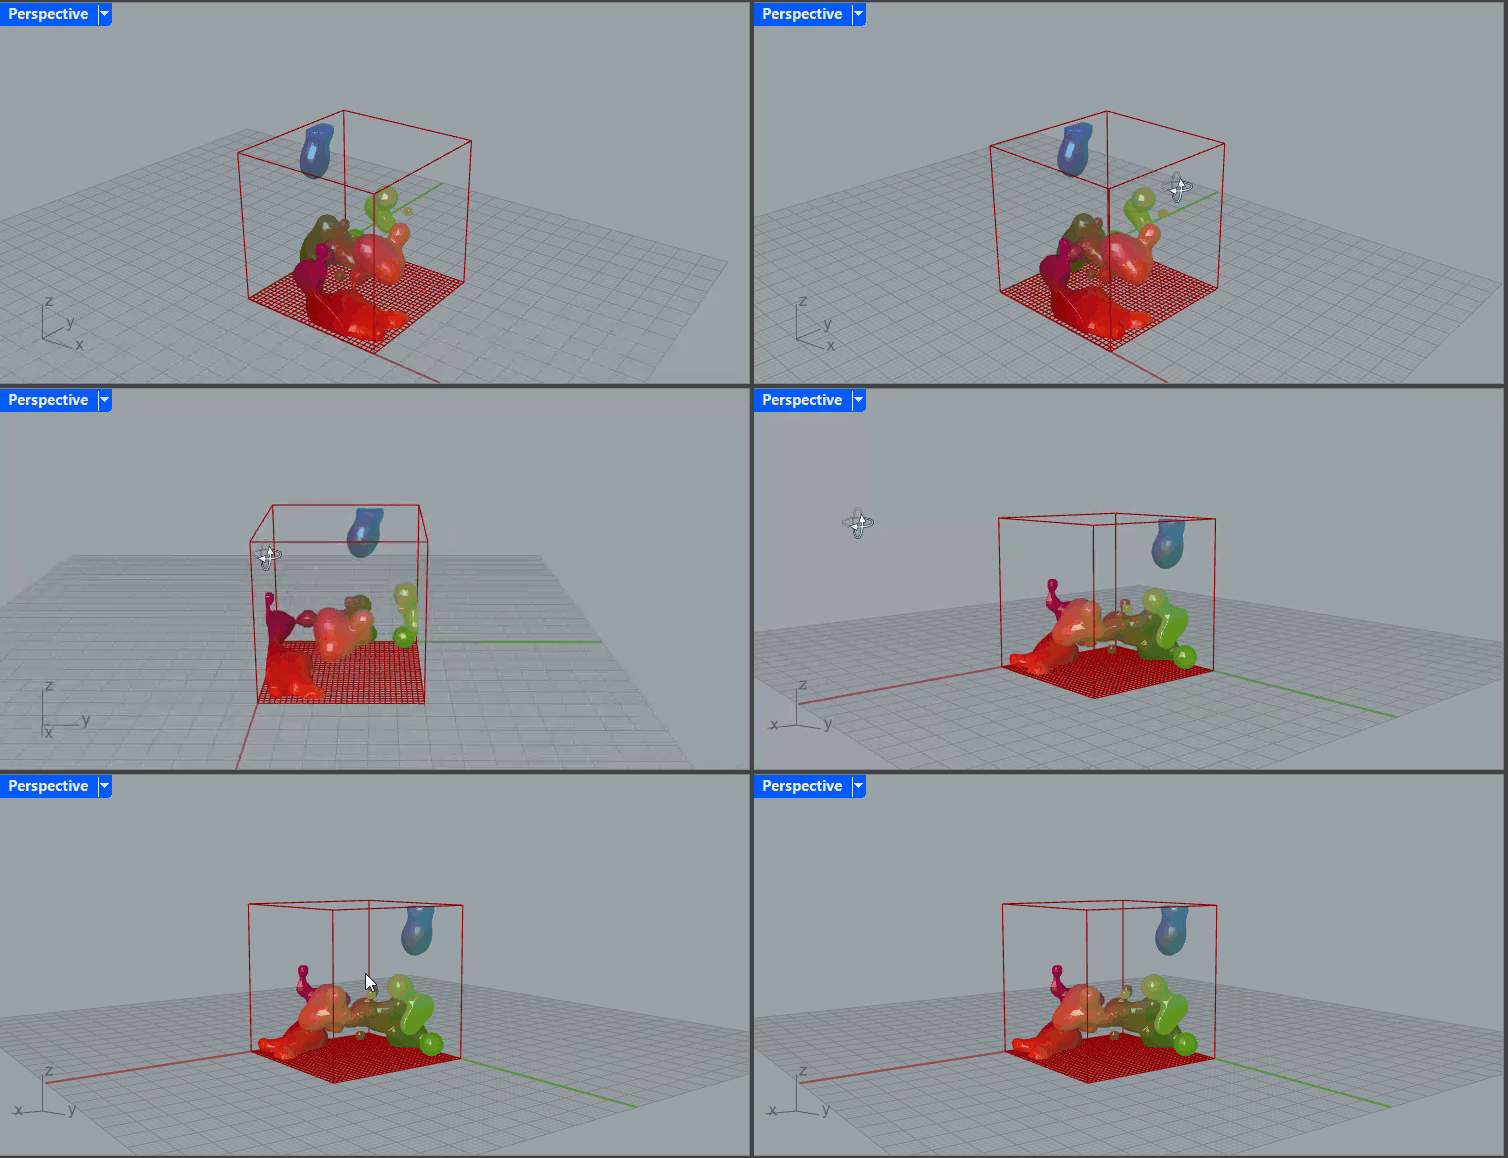
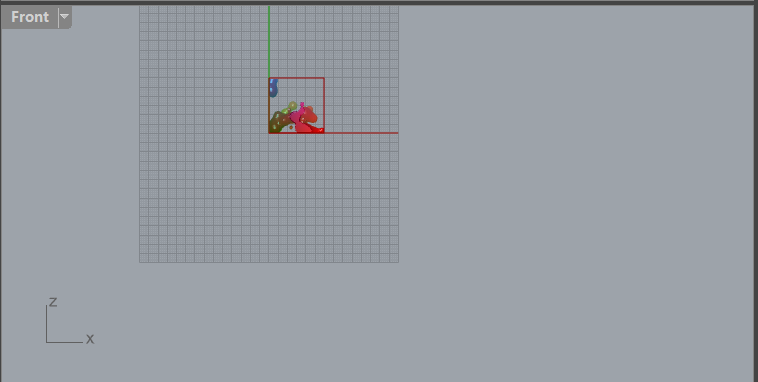
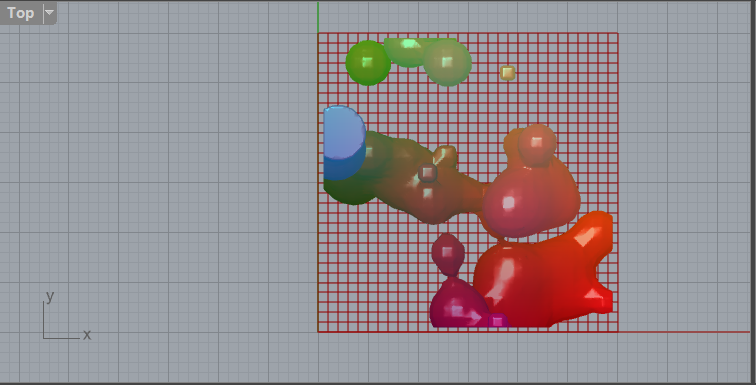
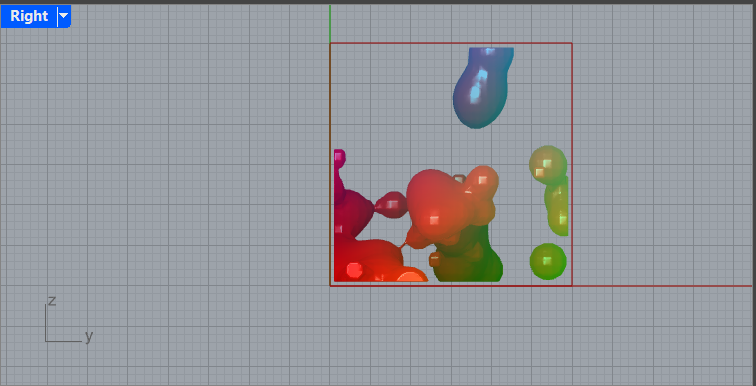
- A colored cloud that is elevated over each country, where the size and color of the cloud corresponds to air pollution intensity.
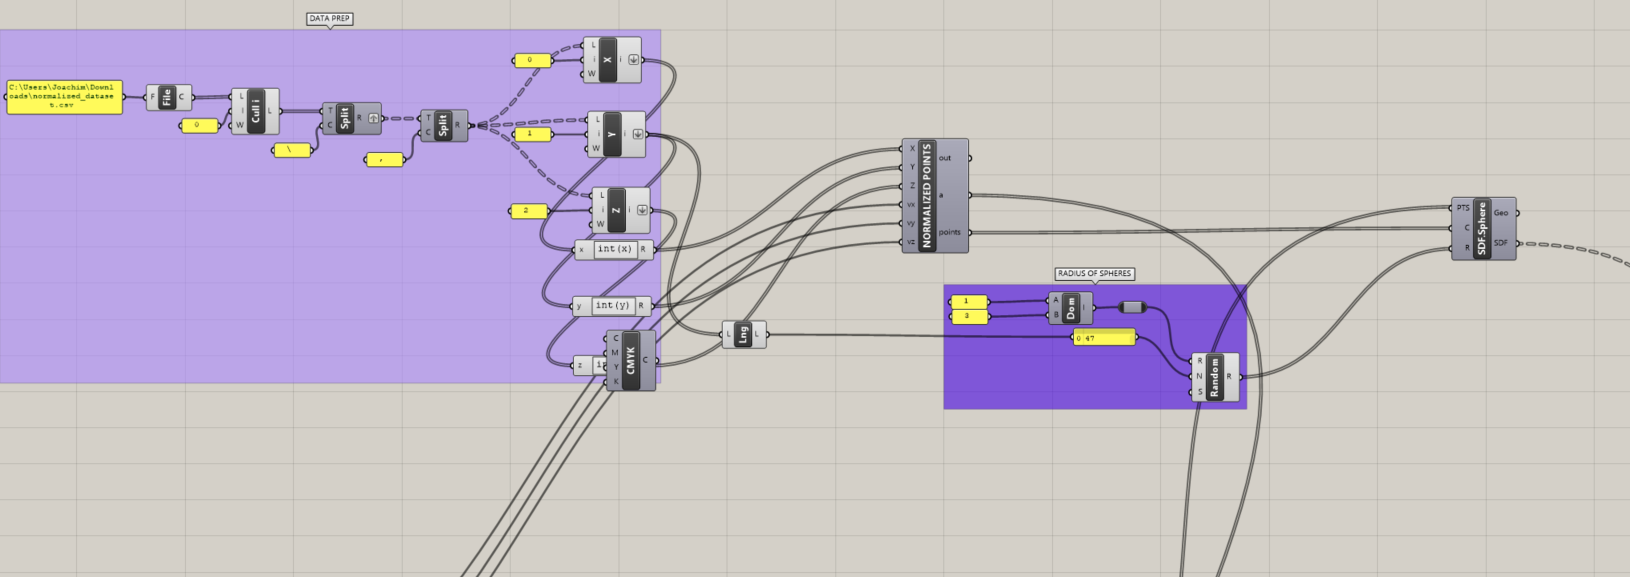
Design/Visualization Process in Rhino and Grasshopper
- Create a 3D grid points.
- Data prep: Converting CSV into integers.
- Offset (scattered points) normalizing points to fit on the 3D grid generated.
- Create spheres using the SDF sphere component, use the location of country as center point and radius population of each country as radius.
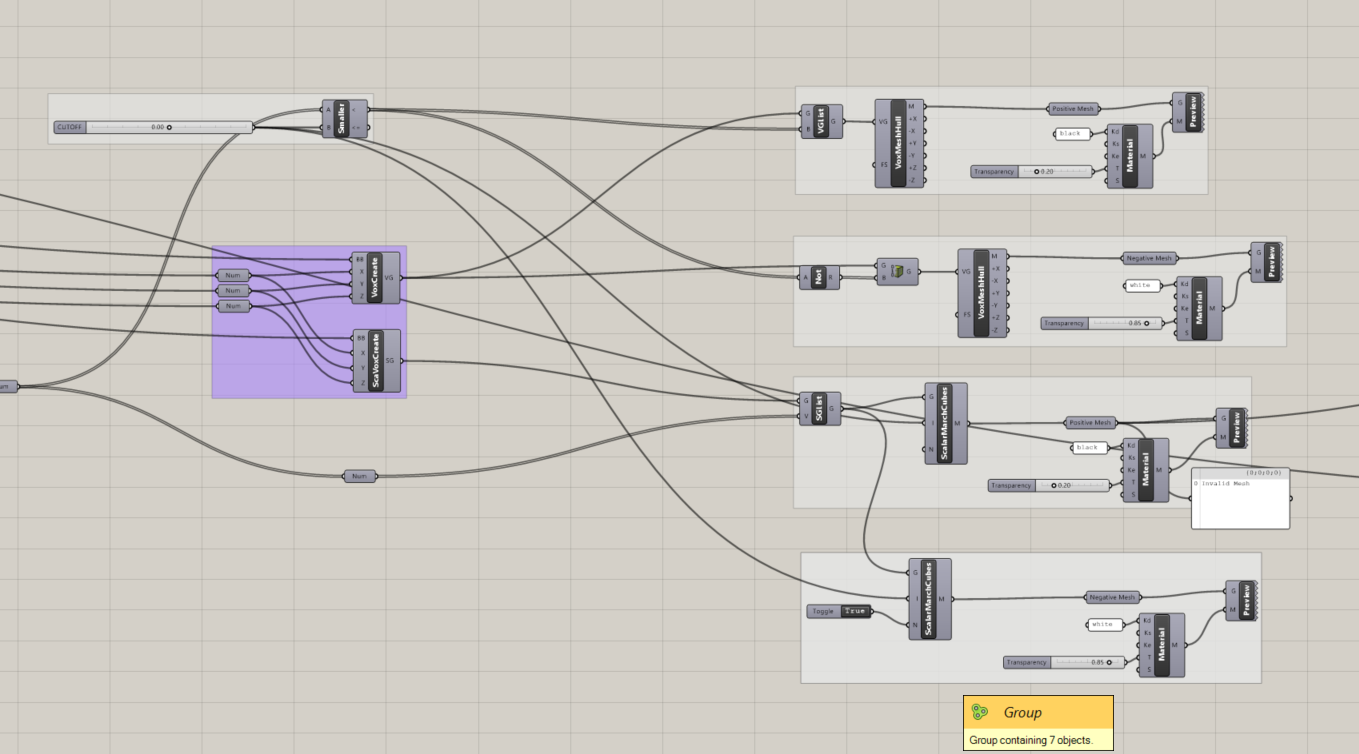
- MeshNot performs a smooth union on the signed distance fields generated, merges SDF sets based on a determined smoothing parameter, outputs a smoothly blended unit.
- Determine the points that are inside and the ones outside using the equality smaller than component.
- Plot these points on the 3D voxel grid.
- Create one mesh with the inner shape and one with the outer one: Done.
- Smooth using the Iso matching cubes component.
- Shrinkwrap with a tight mesh, then apply the color.
